
In 2022, Irish companies with more than 250 employees published their first gender pay gap reports. While some companies were already voluntarily disclosing this information, legislation introduced in 2021 made the publication mandatory. It’s January 2024, and we’re two years in, let’s take a look at what this legislation has given us, and what it’s still failing to do.
A little background
Why am I talking about these gender pay gap reports, isn’t it good enough that the data is out there? Well, in 2022 I added a page on this site which showed the data I had gathered for companies reporting that year. At the end of 2023, I realised that the page wasn’t enough, and that I needed more space and flexibility, so I moved the data to its own site. All of the data gathering has been manual (more on that later), and that means that I have read almost every gender pay gap report published since 2022. All of this means that I am intimately familiar with the quality of the gender pay gap reports that have been published, and I’m unhappy to say that it absolutely is not good enough that the data is out there. Let’s talk about why.
Accessibility
The manual data gathering for the databases has been made much more difficult by the choices made by companies producing the reports. When the government published the legislation, they included specifics about what data should be included in the report, but absolutely no details on what format the report should take, how it should be laid out, etc. This has resulted in the reports themselves arriving in a mishmash of formats including everything from 13 page glossy PDFs with stock photos of happy working women, to single web pages that were overwritten with 2023’s data and Powerpoint files that you have download to access. This has made gathering the data difficult, as it all has to be manually read and gathered. With no standard format, there’s no way to automate the process of gathering the data, as there’s no guarantee you’d be scraping the right data.
Since all of the data gathering has been manual, this has given me a lot of time to think about how people are choosing to present the data, and consider the accessibility failures that they represent.
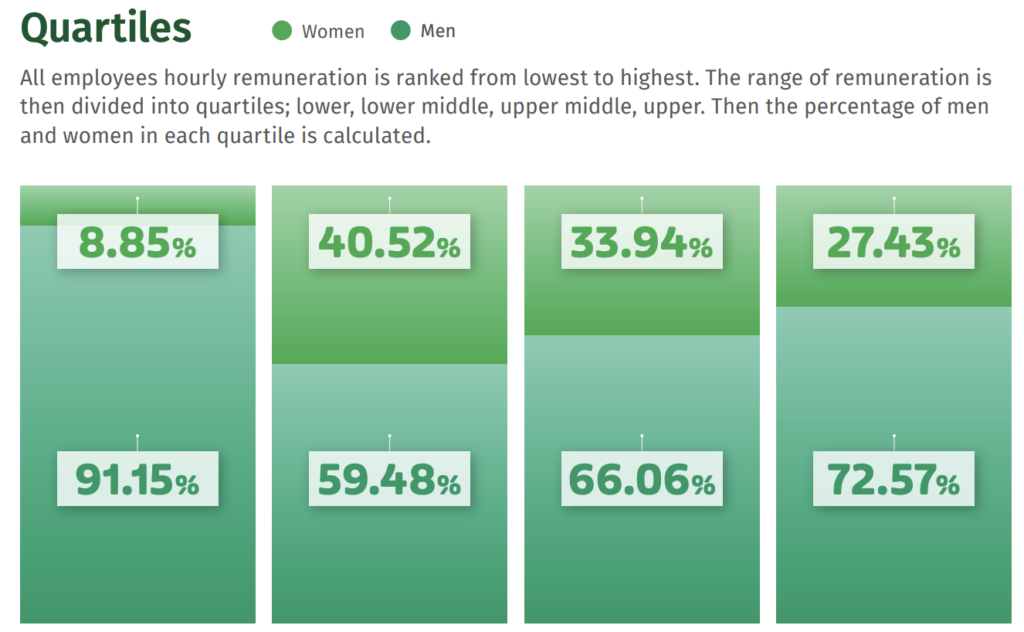
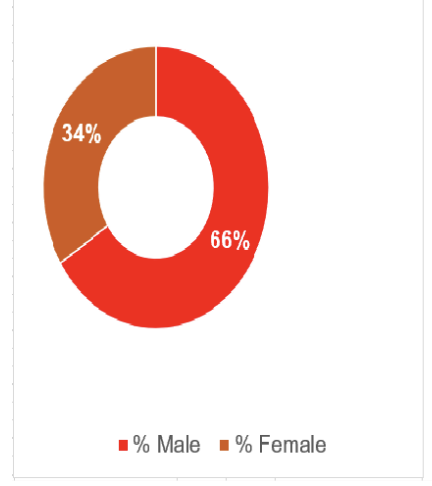
Above is a quartile graph from Coillte’s 2022 gender pay gap report (a format which they repeated in 2023). It’s clear that many entities chose to use brand or theme colours for their reports, but like this example from Coillte, this is very much to the detriment of readability. This green on green graph is extremely unclear even to me, a reader without colourblindness. The legend appears to show the colour of the text in the boxes, not the bars of the graph. The bars in the graph are a gradient which partially matches the text colour, but not fully. And finally the legend itself is so small and far away from the text that it’s very difficult to compare the colours to the graph. This is a barely readable graph, and the information doesn’t appear anywhere else in text-only format, you have to interpret the two similar shades of green in order to read the data. Near-identical shades of green proved a popular theme in 2022, with Respond choosing that palette to display their overall headcount. Again, the colour blocks on the legend are extremely small, making it difficult to be certain which block is which.
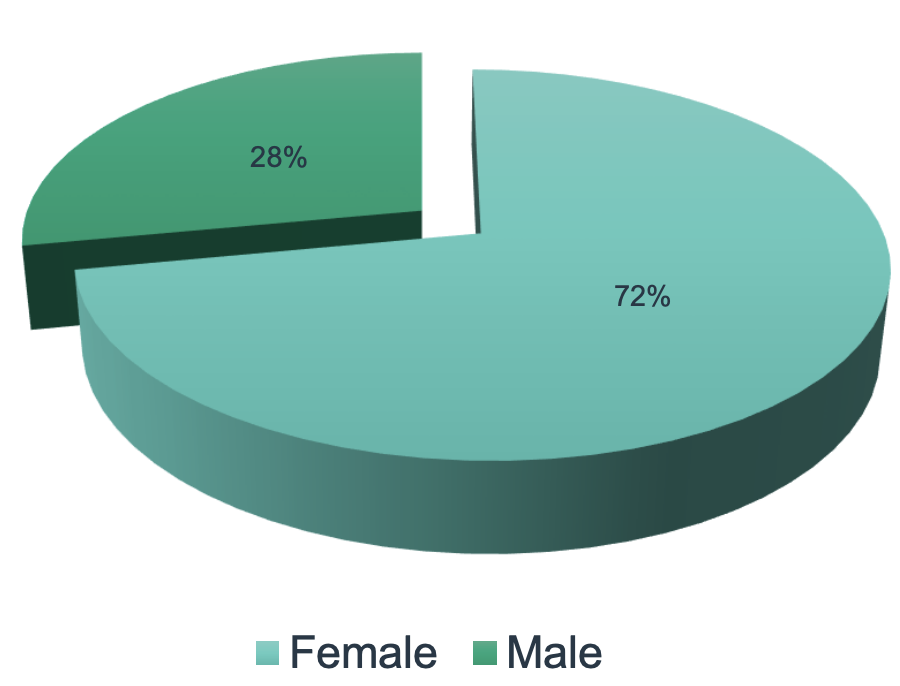
In 2023, Cork City Council chose shades of red and slightly browner red to display the overall proportions of male and female employees. Once again, there’s a repeat of the tiny legend blocks, with not enough colour to allow for a comparison. These colours would also be extremely difficult for people with some forms of colourblindness to read. As with so many other reports, the information is only represented in graph form, so if you can’t accurately interpret the graph, you can’t get the data.
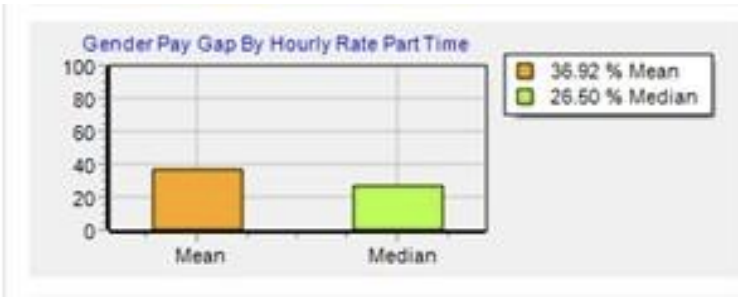
The image on the right is from the Royal Victoria Eye & Ear Hospital’s 2022 report. I have not changed the size or quality of this upload, this is exactly how the image appears in the report. The blurry text in this heavily pixelated image is not reproduced elsewhere in the report in a table, or in explanatory text below the graph. You simply have to zoom in and do your best to read the figures. Is it a 6 or a 5? 26.50 or 25.60? Almost every graph in their report is included like this – obviously a screenshot from their reporting tool included without any consideration of the quality.
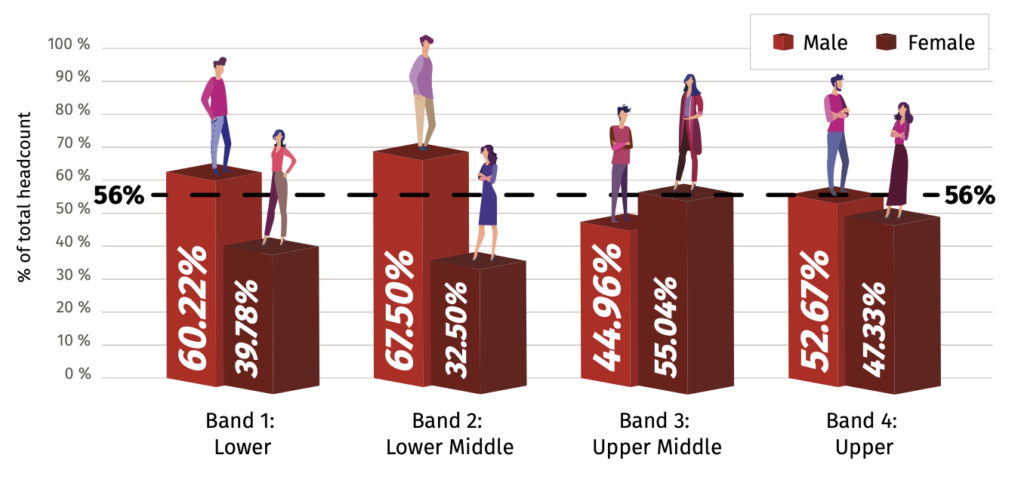
In 2023’s report, Kildare County Council chose to represent their quartile data using shades of red and slightly-darker-red. Because the numbers are represented only by the sideways text on the bars, and the bars change size, the font also changes size for each number, and finally, in case you thought you could be certain about which bar represents male and female, the little figure on the top of each bar also changes for every single bar…
At the risk of making this an overly long post, I wanted to highlight just one more pair of graphs.
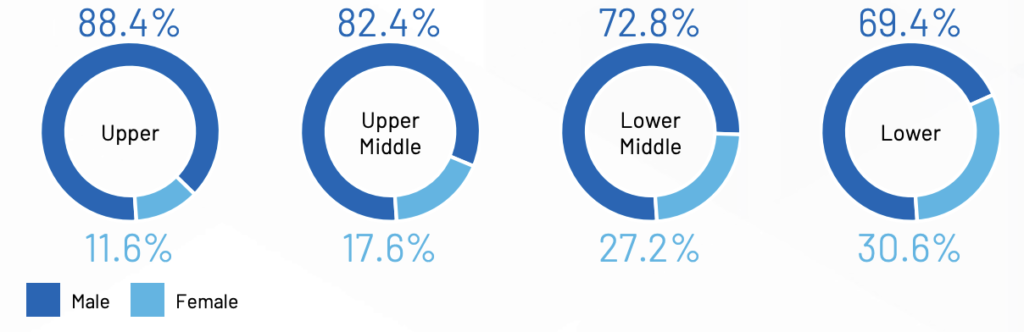
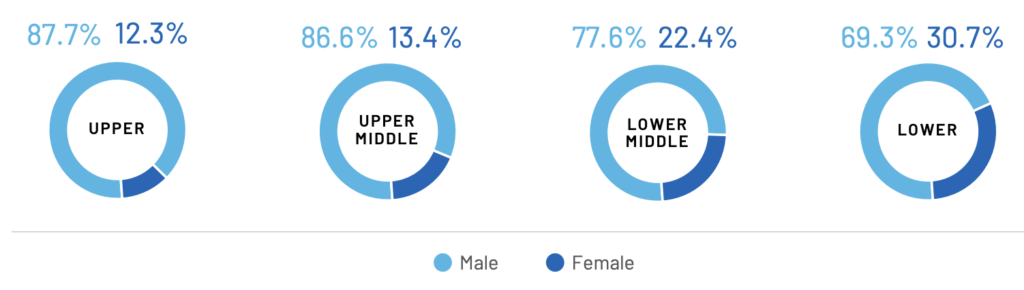
These are the quartile graphs for Analog Devices. On the left is the graph for 2022, and the right is 2023. At a quick glance, you would be forgiven for thinking that incredible progress had been made, and that the upper quartiles now contain far more women than men, but look again. The proportions haven’t changed much at all, but the colours have been flipped between the years, so that the colour which represented male in 2022 represents female in 2023. A charitable interpretation of this is that they are simply using brand colours, and whoever compiled the 2023 report didn’t see the 2022 version. A less charitable interpretation of this is obvious.
Truly, this section could go on for pages, it could be (and maybe soon will be) a gallery of data visualisation sins spanning many more reports. The selection I’ve shared above are not the only offenders, merely some of those I noted while reviewing reports. And while it’s been simply frustrating for me to get the data from these graphs, anyone using a screen reader, anyone with a form of colourblindness, etc. would likely struggle to interpret any data from many of these reports. These reports don’t meet basic accessibility standards, making them useless for many people.
Oversight is an oversight
If you’re thinking that surely someone, somewhere, must be overseeing these reports, and wondering why they haven’t asked the companies to do a better job, you are going to be disappointed. With no government provided central portal for all the reports, there is also absolutely no oversight of the reports. No government body has been appointed or designated as the people who should oversee the reports and make sure they are readable and contain all the information that they are supposed to. The result of this is clear to anyone who reads more than a few of the resulting reports.
Since the beginning of reporting, companies have been publishing reports that do not meet accessibility standards, that do not include all of the data they should, or that include data that has been incorrectly calculated or reported. The Brothers of Charity reported their figures in Euro rather than percentages (which is the specified reporting method) in both 2022 and 2023. Several companies (Actavo, Ardmac, Depaul, Dublin Bus, to name just a few) did not report their quartiles correctly, some didn’t include part or all of the data (Mazars, Standard Life).
The legislation says that the reports must be accessible for three years, but when I undertook a review of my 2022 dataset, the number of broken links was substantial. Some companies moved the files and it was easy to find them again, but other companies have simply overwritten last year’s webpage, obliterating their 2022 data.
Lastly, as I write this it is the 24th of January. Given that companies must choose a date in June and then have 6 months from that date to report, every single company report was due on or before December 31st. As you can see from the “missing” page on my portal, that has not happened. Allowing for the fact that some companies may have published in the few days since I last checked, or that I may be missing the link to one or two of these companies, it is fair to say that the majority (if not all) of the companies on the list are late with their report. And this is exactly what happened in 2022 also – companies were publishing reports well into the first quarter of the year, with absolutely no sanctions. I expect to still be gathering 2023 data well into March or April of this year.
Failure to centralise
Gender pay gap reporting has been included in UK legislation for several years, and there is a central portal available for the reports. Companies submit their data there, and this is a database that anyone can search. While the Irish government promised a similar central portal, they have now said they have no timeline for this will be available. This is perhaps the biggest and most disappointing failure of all with respect to this legislation, as the lack of a portal fundamentally undermines the point of publishing the data in the first place.
Having data on the pay gaps in Irish companies is so useful, but only if people can actually use the data. In its current form, it is effectively unusable. People who want to compare the data from one year to the next are left with no choice but to build their own database and perform their own calculations. With reports that go missing each year, that have different formats, and omitted data, you’ve got to build up some sort of spreadsheet yourself to even view the change over time. The same is true for people who wish to compare companies across certain industries, for example. And for those who don’t want to become citizen data scientists simply to understand where their own employer stands, where do they go?
With no central portal, no standard format, and no oversight about the correctness of the reports, the companies might as well be printing them out and then throwing them straight in the recycling bin.
Wrapping it all up
It will come as no surprise to anyone who’s read this blog, or spoken to me in person, that I believe that sunlight is the best disinfectant – i.e. the best way to promote change is to show the current state of play in black and white. Viewing the pay gaps and quartiles for companies makes it abundantly clear that there is still a long way to go in terms of female representation in certain industries, and in higher paying jobs in many industries. Companies often invest a lot in PR about how they do so much for their female employees, but the figures don’t lie, and that’s why it is so important to have this data accessible to everyone.
While I am proud of the work I’ve done with my gender pay gap portal, my ultimate desire is that this be a redundant project. It shouldn’t be up to me or any other individual citizen to deliver on a promise made by our government, to hold companies accountable for the deadlines they miss, and to remind them of their legislative obligations. As time passes, the number of companies included in the mandatory reporting will increase and this will become unsustainable for me, as one individual, to maintain.
The original legislation has gotten us halfway there, it’s not good enough for the government to simply drop the ball now. They need to bring this across the finish line, and deliver an effective portal that everyone can use, that can act as a long term historical repository, and that actually makes this publishing worthwhile.
Leave a Reply